
2 in 3 buyers visit more than once. Here's what happens to their cart.
New R+ Persistent Cart data shows how much Shopify revenue rides on the cart being there when they return.
November 16, 2026
7 min read
In this article

Subscribe to Our Newsletter
Get mobile commerce insights. No fluff, just what you need to build smarter.
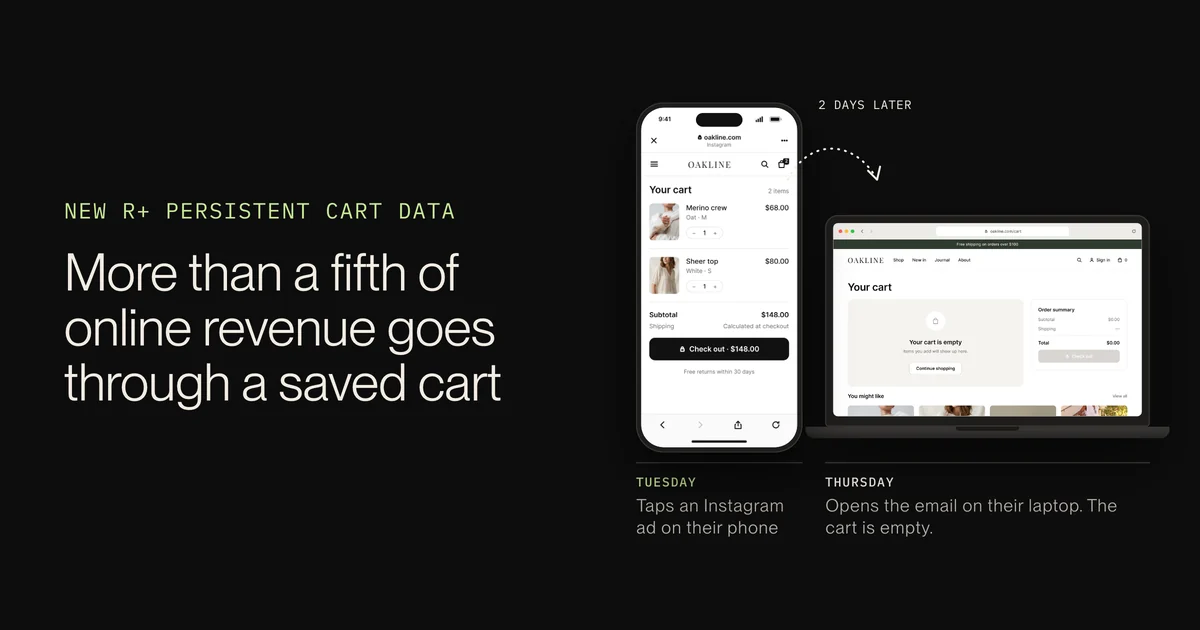
Guest post from Volodymyr Hlushko, co-founder and CTO of Refactor Plus, the team behind R+ Persistent Cart. Cart sync with R+ is now live in Reactiv apps, and we asked Volodymyr to share what their data shows about shoppers who come back.
Most shoppers don't buy on their first visit. They browse on their phone, add a few things to the cart, and leave. Then they come back an hour later, or two weeks later, on a laptop, from an email link.
When they return, one of two things happens. Either their cart is waiting for them, or it's empty and they have to find everything again.
On a standard Shopify storefront, the cart belongs to the browser it was built in. If the shopper switches devices, opens a link in a different browser, or clears their cookies, the cart stays behind.
I've been building on Shopify for nine years, and we built R+ Persistent Cart to close this gap. It saves a signed-in shopper's cart to their account, so the cart follows them across sessions and devices. With it now running on live stores, we wanted to answer a simple question: how much revenue actually rides on the cart being there when the shopper comes back?
What the numbers say across stores
We looked at Online Store orders across 10 stores running R+ Persistent Cart, from September 3 to November 2, 2026. Two definitions first:
- A saved cart is a signed-in shopper's cart that we keep on their account, so it's still there when they return.
- A restored cart is a saved cart that was loaded back for the shopper when they came back, on the same device or a different one.
On average:
- 15.1% of Online Store orders went through a saved cart.
- Those orders brought in 21.5% of Online Store revenue.
- 20.6% of saved carts were later restored.
- 3.5% of Online Store revenue came from orders where the shopper's saved cart was waiting for them when they came back.

3.5% sounds small until you set it against a store's revenue. For a store doing $10 million a year online, it would mean about $350,000 in orders that started with a cart being restored. (That's an illustration, not a store in our data.)
To be precise about what that number means: not every one of those orders would have disappeared without a saved cart. Some shoppers would have rebuilt their cart from memory. But every one of them would have had to do it at the exact moment they came back ready to buy. That's the worst moment to make a shopper do extra work.
Notice too that saved-cart orders take a bigger share of revenue (21.5%) than of orders (15.1%). Carts built across more than one visit tend to be bigger carts.
Inside one Shopify Plus store
One Shopify Plus merchant gave us access to their Shopify Analytics and approved sharing the results anonymously. It's a store with a high average order value and modest volume. They installed R+ Persistent Cart in late April 2026. Here's what we saw over 192 days, from April 25 to November 2, 2026.
3 in 10 saved carts came back. Shoppers saved 3,997 carts, and 1,195 of them (29.9%) were restored when the shopper returned.
Saved-cart orders were bigger. Orders that went through a saved cart averaged $516. That's 12.7% more than the store's average online order of $458. Together, those orders made up 7.8% of Online Store revenue, and we estimate that restored carts alone accounted for 2.3%.
More carts turned into orders. We compared January to April 2026 (before the install) with May to October 2026 (after it):
- Cart to checkout: 44.4% before, 56.3% after (+11.9 points).
- Cart to order: 17.2% before, 20.5% after (+3.3 points, so 19.5% more carts became orders).
To check that this wasn't seasonal, we looked at the same months of 2025, before the app was installed. That year the share of carts that became orders went the other way, falling from 18.4% to 12.9%.

Shoppers who came straight back to their cart finished far more checkouts. This is the clearest signal in the data. Take only the visits where the first page a shopper landed on was the cart. The number of those visits barely moved (2,566 before, 2,476 after). Completed checkouts from them rose 82.6%, from 437 to 798, and their conversion rate went from 17.0% to 32.2%. When shoppers came back to their cart, it was more often full.
It's a before-and-after comparison, not a controlled test. Other things changed at the store over the same period, including traffic: sessions fell, almost entirely in direct visits, while social and search held steady. The rates above are per cart, so they don't depend on session counts. But the direction is consistent across every cut we made, and it runs against the store's own seasonal pattern.
Why the cart has to follow the shopper
The same store's data shows how much of a purchase happens across more than one visit. Across 6,480 orders from January to October 2026:
- 2 in 3 buyers visited more than once before buying (66.8%). Nearly half visited three or more times.
- More than a third bought on a later day than their first visit (35.7%). 1 in 5 took more than a week to decide.
- 1 in 5 came back through a different channel than the one that first brought them (20.9%). They found the store through an ad or a search, then came back another way to buy.
- More buyers come back directly than first arrive that way. Direct visits were 20.3% of first visits but 25.9% of the last visits before a purchase.
- 9 in 10 sessions were on a phone (90.7%), and phones produced 94.1% of completed checkouts.
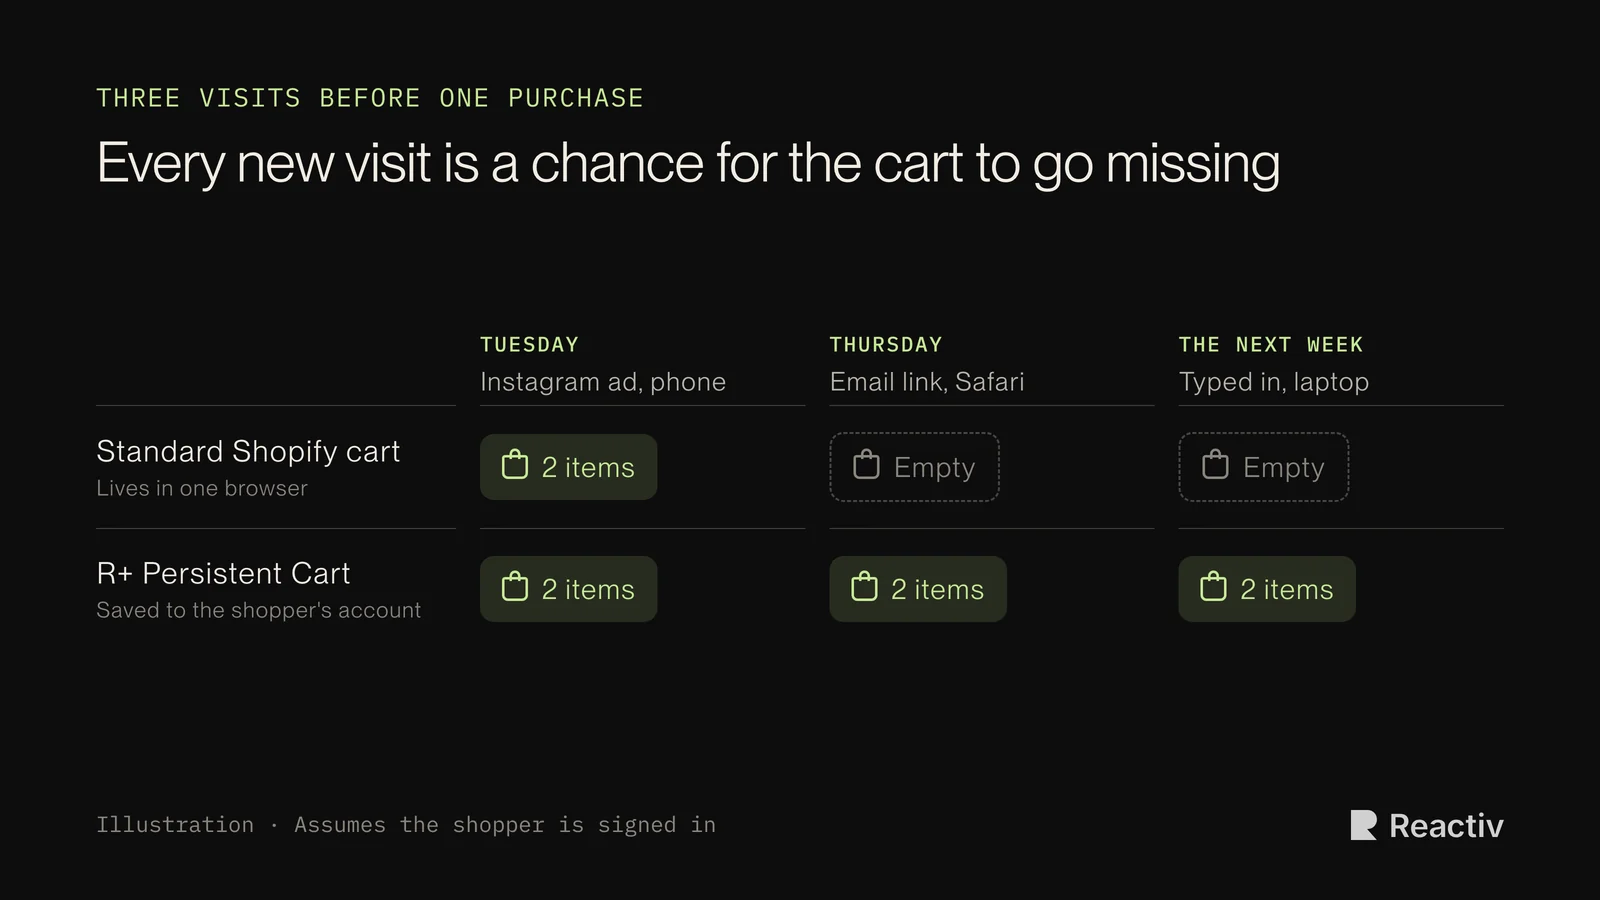
Put those together and you get the real shape of a purchase: several short visits, spread over days, arriving from different places, mostly on a phone. Every one of those visits is a chance for the cart to go missing. A link from an Instagram ad opens in Instagram's own browser. The next visit comes from an email and opens in Safari. A cart built in one doesn't exist in the other.
One more finding stood out. Signed-in shoppers visit more before they buy. Shoppers with an account visited a median of 3 times before buying, against 2 for guests, and 74% of them came back at least once (against 65% of guests). The shoppers most likely to return are the ones with accounts, and those are exactly the shoppers whose cart can be saved to their account and follow them.
The cart now lives in more places
This gets harder as stores add channels. A shopper might start a cart in a brand's mobile app, check reviews on the website, and finish the purchase somewhere else. Each sales channel keeps its own cart, and by default none of them know about the others.
So we rebuilt how R+ Persistent Cart works with headless channels. It now keeps the latest cart for each sales channel, and any connected channel can pick up the cart a shopper built anywhere else. The Online Store cart still updates automatically, as it always has.
Mobile apps were the obvious next place for this, because app shoppers are usually signed in. Cart sync is now live in Reactiv apps, the first app platform to get it.
"Shoppers don't think in channels. They tap a push notification on the train, then finish on their laptop that night. Most of our merchants' app shoppers are already signed in, so the app is the easiest place for a cart to follow someone, and the most frustrating place for it not to."
Zack Elias, Co-founder, Reactiv
Running a Reactiv app? Talk to your CSM to turn on cart sync. Thinking about an app? Book a call with Reactiv.
What to check in your own store
You don't need our app to see how much of your revenue depends on shoppers coming back. Four checks in Shopify do most of the work:
- Visits and days before purchase. Shopify's conversion summary on each order shows how many sessions the shopper had, and over how many days. Pull a sample of recent orders and count how many took more than one visit.
- Sessions that land on the cart page. In Shopify Analytics, look at sessions by landing page, filter to /cart, and check their conversion rate. These are shoppers coming back to finish. If that rate is low, ask what they found when they got there.
- Device mix. If most of your sessions are on phones but your shoppers also come back on desktop, carts are getting stranded between devices.
- Orders from customers with accounts. These are the shoppers whose cart can follow them. If the share is small, making sign-in easier may be worth more than any single cart feature.
If your numbers look anything like the store above, a meaningful share of your revenue rides on one thing: the cart still being there when the shopper comes back.
About the data
- Cross-store figures are rounded averages from 10 stores running R+ Persistent Cart, covering September 3 to November 2, 2026. No store, merchant or shopper is identifiable.
- Single-store figures come from one Shopify Plus merchant's Shopify Analytics, shared with permission. App results cover April 25 to November 2, 2026. The before-and-after compares January to April with May to October in 2026, and the same months of 2025. Sessions are human sessions only. Visit, timing and channel data covers January to October 2026.
- Shopify doesn't record whether a buyer was signed in at checkout. "Signed-in shoppers" uses each customer's current account status as the closest signal.
- Shopify doesn't show how many shoppers used more than one device, so the device figures describe sessions, not device switching.




See Reactiv on your storefront.
Book a demo and we'll walk you through native apps and App Clips running on your Shopify store.